Lorde Said "Solar Power" And She Meant It
Almost six years ago, a meme centered around economic data and pop music — perfectly calibrated to hit the nexus of my interests — started being posted online. It was a simple time series line graph of the U.S. unemployment rate from about early 2013 to late 2018 with a caption pointing to the release of Britney Spears “Work Bitch” single in 2013.
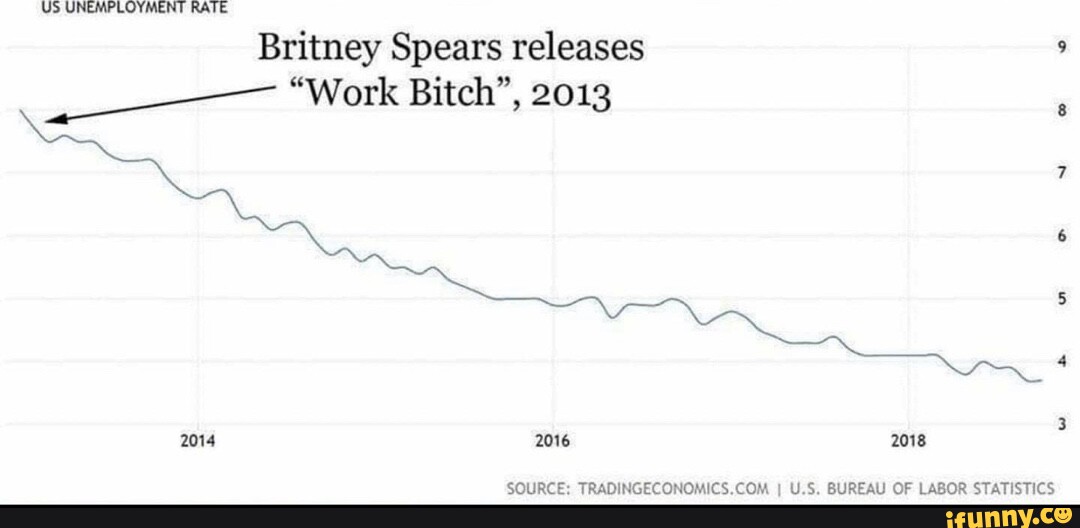
The message is simple: in the period of time shown on the graph the U.S. unemployment rate declined from 7.2% in September 2013, the month the song was released, to around 3.7% five years later. The implication is clear, the message behind Britney’s lead single of her eighth studio album — which peaked at number 12 on the Billboard Hot 100, her fifth highest debut single — was powering a resurgence in the American labor market. She sings in the chorus:
You want a hot body? You want a Bugatti? You want a Maserati? You better work bitch. You want a Lamborghini? Sip martinis? Look hot in a bikini? You better work bitch. You wanna live fancy? Live in a big mansion? Party in France? You better work bitch. You better work bitch. You better work bitch. You better work bitch.
And apparently, we all listened! Even the second highest comment on the official music video currently says “Can’t believe Britney Spears invented economics”. The phenomenon even got a cringe-worthy Buzzfeed writeup! Well, expanding the unemployment rate data out in each direction a few years checking reveals some stark differences.
Looking at the U.S. unemployment rate in the context of the full period of the last two business cycles shows two periods of substantial decline. The first more prolonged one after the official end of the Great Recession in 2009 and a second sharper one coinciding with the end of the COVID-19 induced recession. Looking at this view of the data, it’s more apparent that declines in unemployment are more related to the ends of the recessions rather than Britney Spears releasing “Work Bitch” in 2013.
The type of error in data analysis — which the original meme was meant to highlight — is related to the well-known axiom in statistics that “correlation does not imply causation”. Specifically, when looking at a line graph of data over a period of time it’s natural to ascribe causality to a subsequent change in the trend of the data after an event, especially if it is noted in the visualization. This phenomenon is part of a handful of causality errors that can be implicitly reinforced by how data are visualized. In part, it’s related to the way our brains are designed to identify patterns and even construct them where they might not meaningfully exist.
There’s another great example with a topical hit song. The U.S. solar electricity generation and the release of the title track of New Zealand singer-songwriter Lorde’s third studio album “Solar Power”:
The single was appropriately released on a solar eclipse in June of 2021. According to data from the Energy Information Administration the total net solar electricity generation in the US since its release has doubled from around 12.3 million megawatthours to 21.7 in four years.
It’s tempting to cheekily attribute the expansion of the solar electricity generation in the US to the timing and theme of a pop star’s record. However much like Britney Spears’ “Work Bitch” viewing the data in a time series that extends further back begins to reveal just how meaningless that association is:
Putting this increase in solar energy generation into a bit of perspective is key. It’s not the case that solar is anywhere close to the leading source of electricity generation in the country. Currently it is still natural gas which over took coal in 2016 and as of 2023 accounted for about 43% of the total 4.2 trillion megawatthours of electricity generation.
That said, solar power jumping from about 0.04% of total electricity generation in 2011 to almost 4% in 2023 is nothing to sneer at. Much of that exponential growth has occurred in the last five years and doesn’t even include small-scale solar photovoltaic (PV) systems like residential rooftop panels that are not utility-scale. Those sources, which are typically installed at or near the residential, commercial, or industrial sites they provide power for, accounted for almost 31% of total solar electric generation in 2023.
The growth of solar as a major component of not just renewable but total electricity generation is no accident. Both major technological and policy changes have made the emergency of solar possible. Falling costs for crystalline silicone fixed-tilt panels helped drive the costs for solar down 50% from 2013 to 2018. Since the mid-2010s the cell efficiency on solar panels turning sunlight into electricity stood at a high of about 35%. That has risen to almost 50% as of writing. Battery storage technological improvements that are powering advancements in capacity in a variety of renewable sectors are increasingly being paired with solar generators to the tune of about 9.4 gigawatts (GW) from 2021 to 2024.
These massive advancements in solar energy generation and storage have coincided with significant legislation to continue spurring their adoption in the U.S. Specifically, the Inflation Reduction Act (IRA) signed by President Joe Biden in August of 2022 has provided a 30% investment tax credit for residential, commercial, and utility-scale photovoltaic (PV) and concentrated solar power (CSP) installation. It also included an additional 2.6 cent/kWh production tax credit for new PV and CSP systems at utility-scale. The law also extended time window of the investment tax credit for households who install a residential PV system out to 2034.
All of these incentives are massive reasons why between 2020 and 2021 the 24 gigawatts (GW) of utility-scale solar photovoltaic (PV) capacity that came online was double the 12 GW added to the power grid from natural gas. Overall about 60% of planned new U.S. electric generating capacity in 2022 and 2023 was from solar and battery storage. This number bumped up to over 80% of the total planned 62.8 GW as of 2024. According to the latest data from the EIA from June ‘24 this proportion is set to continue to come in between 60% and 75% through 2027.
For all the ink spilled in the last decade about the advancements in artificial intelligence and the emergence of cryptocurrency, a technological revolution in solar energy and the battery storage methods that are empowering it might have some of the longest-reaching impacts both on our economy and the environment. While the U.S. of course isn’t nearly the only country that needs to develop and install more renewable energy capacity, its finally doing the work to begin the desperately-needed transition to both cleaner and cheaper forms of energy production, storage, and use.
Data and code underlying this article can be found in this GitHub repo.